Skip Navigation Links

THE SUN  

Why We Study the Sun  
The Big Questions  
Magnetism - The Key  

SOLAR STRUCTURE  

The Interior  
The Photosphere  
The Chromosphere  
The Transition Region  
The Corona  
The Solar Wind  
The Heliosphere  

SOLAR FEATURES  

Photospheric Features  
Chromospheric Features  
Coronal Features  
Solar Wind Features  

THE SUN IN ACTION  

The Sunspot Cycle  
Solar Flares  
Post Flare Loops  
Coronal Mass Ejections  
Surface and Interior Flows
Helioseismology  

THE MSFC SOLAR GROUP  

The People  
Their Papers  
Their Presentations  

RESEARCH AREAS  

Flare Mechanisms  
3D Magnetic Fields  
The Solar Dynamo  
Solar Cycle Prediction  
Sunspot Database  
Coronal Heating  
Solar Wind Dynamics  

PREVIOUS PROJECTS  

GOES SXI Instrument
MSFC Magnetograph  
MSSTA
Orbiting Solar Obs.
Skylab
Solar Maximum Mission
SpaceLab 2
TRACE
Ulysses
Yohkoh

SOUNDING ROCKETS  

Chromospheric Lyman-Alpha Spectro Polarimeter (CLASP)
CLASP2
CLASP2.1
Marshall Grazing Incidence X-ray Spectrometer (MaGIXS)

CURRENT PROJECTS  

GONG
Hinode
RHESSI
STEREO
SDO
SOHO

OUTREACH  

The Sun in Time  
Solar Information for Teachers  
Eclipses and the Sun -- Girl Scouts

FUTURE PROJECTS  

Solar Probe Plus  
Interstellar Probe

VIDEOS  

NASA Videos

How To Find Your Solar Flare Information


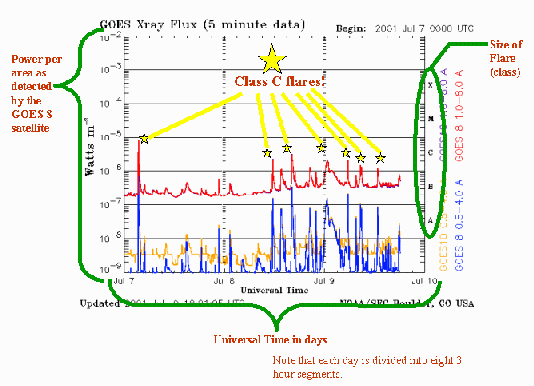
To complete your data table each day you will use two tools: a graph of data from the GOES 8 satellite and an Active Region Table from NOAA.


First, take a look at the GOES plot below. Click on the HOW? button to find out how scientists can use similar plots to analyze active regions.


flare classes link

The plot in red shows data from the GOES 8 satellite. The spikes represent solar flares. You can determine the size of a flare by looking at the scale on the right side of the graph.

Can you see that four class C flares occurred on July 9th?


Now that you can find flares on a GOES 8 plot, check out the NOAA data table below to see how you can determine which active regions flared.

Big Bear Solar Observatory has a neat table of NOAA daily active regions.
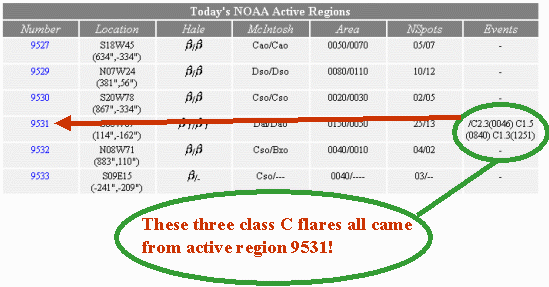
Noaa table

Are you ready to begin your diary? Just click on the buttons below to take you to today's data. Don't forget that to get back to this website you just click on the back arrow!


goes button noaa button back to diary
Web Links
SpaceWeather.com - Space Weather Homepage Updated Daily
SolarStorms.org - Learn More About Space Weather and Solar Storms
High-Energy Astrophysics - MSFC's Imaging X-Ray Polarimetry Explorer (IXPE)
First Gov Image + NASA Privacy, Security, Notices
+ Visit Solar Terrestrial Probes Program
+ Visit Living With a Star Program
NASA Logo Image Author: Mitzi Adams, mitzi.adams @ nasa.gov
Curator: Mitzi Adams, mitzi.adams @ nasa.gov

Last Updated: January 03, 2007